The Lab Space at DSG
The Digital Scholarship Group at Northeastern University is developing a digital Lab space to showcase experiments with data analysis and visualization. The Primary Source Cooperative editions are providing early pilot projects for the Lab, where the edition data will be remixed and reshaped to reveal new patterns and interconnections.
Scholarly editors working with the Primary Source Cooperative are creating digital editions using the TEI Guidelines: creating data which captures the structure of each individual document together with detailed metadata and information about the contents of the document, including people and topics discussed. That data is transferred via a data pipeline of the Lab’s design to bring it into the domain of the Digital Scholarship Group technical infrastructure. The raw files are stored in Amazon Web Services, and the data is indexed in an XML database to provide support for querying and for extracting specific features of the data for further analysis. From either of those endpoints, the data of the TEI is available for creative development by DSG’s analysts.
Using a combination of open-source tools for natural language processing, network analysis, and visualization in Python and JavaScript, the Lab is exploring ways to begin exploration around researchers’ questions — and help them develop their own.
Below are some screenshots of prototype visualizations produced using Python data processing and the D3.js visualization framework, based on data from the John Quincy Adams Digital Diaries project, the Catharine Maria Sedgwick Online Letters, and the Papers of Roger Brooke Taney.
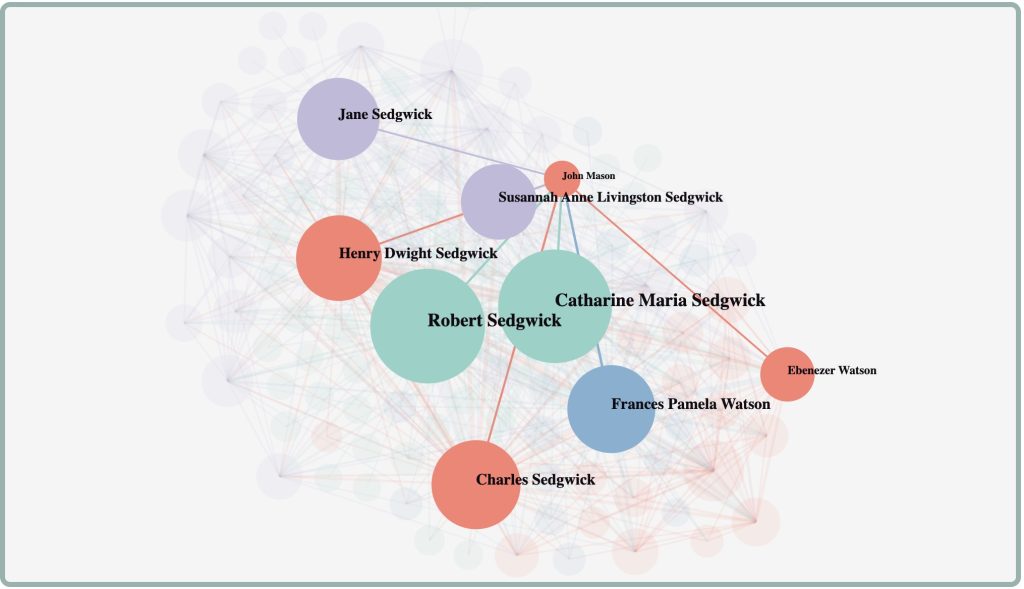
Co-reference Network Graph
Editors at the Massachusetts Historical Society tag people who are referenced in each entry of Catherine Maria Sedgwick’s Online Letters. Using Python data science libraries, we can calculate and analyze groups of people who are being referenced within the same letters as a way to understand the networks of relationships between people in Sedgwick’s life. Using Javascript, we can create network visualizations to showcase this interconnectivity between these different people. Nodes in the graph whose connecting edges are thicker and more strongly linked together often appear in the same letter, and nodes that are larger are referenced more frequently.
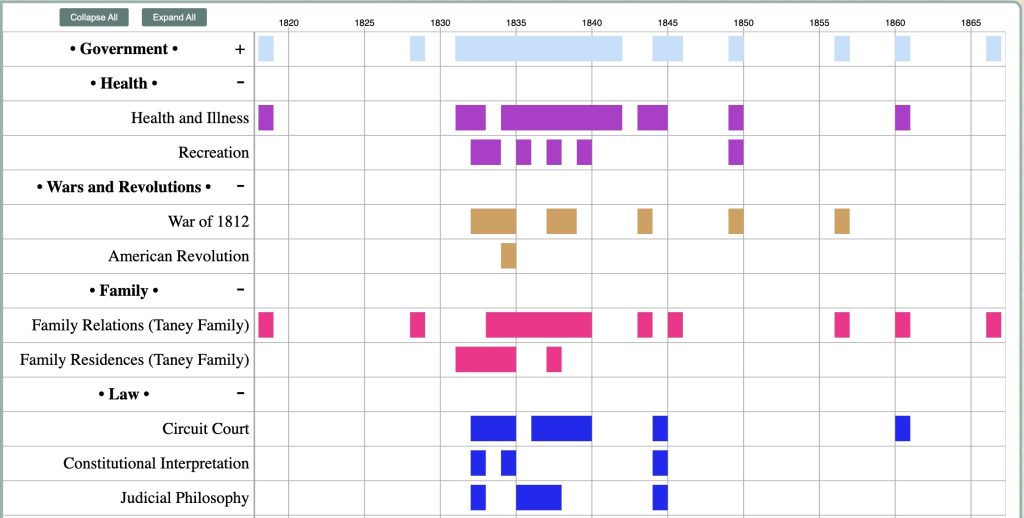
Subject Reference Timeline
Below is a timeline of subjects from the Papers of Roger Brooke Taney, plotted by year and when that topic appears. Editors of the XML would assign topics to each diary entry or letter, and these were all accumulated and then grouped together by year. Topics are all under a topic umbrella assigned by the MHS, and you can collapse or expand topics under their umbrella. Each topic, topic umbrella, and appearance of the topic on the timeline chart can be clicked to bring you to the Primary Source Cooperative website. With this tool, you can better understand when authors were talking about similar or different topics over the broad temporal range of the collection.
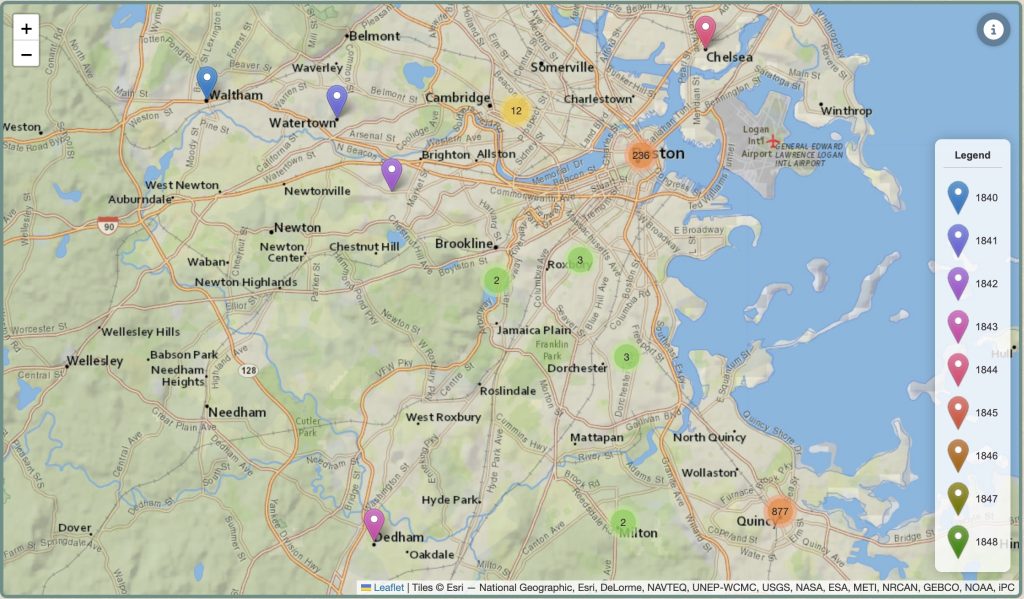
Geo-reference Map
Below is a map plotting John Quincy Adams’s movements and locations from his diary entries from 1840-1848. Each marker indicates a diary entry he wrote, and the location is generated from the dateline he would write at the top of each entry during this time period. These datelines were tagged by the editors, and then extracted by a parser script and ran through a Python Named Entity Recognition model that would identify location-related entities. They were then hand-checked and after manual verification ran through a geocoding API to receive the latitude and longitude coordinates. They were then plotted onto a map using the Javascript library Leaflet. You can click on each of the markers to go back into the Primary Source Cooperative website to read the diary entry.